
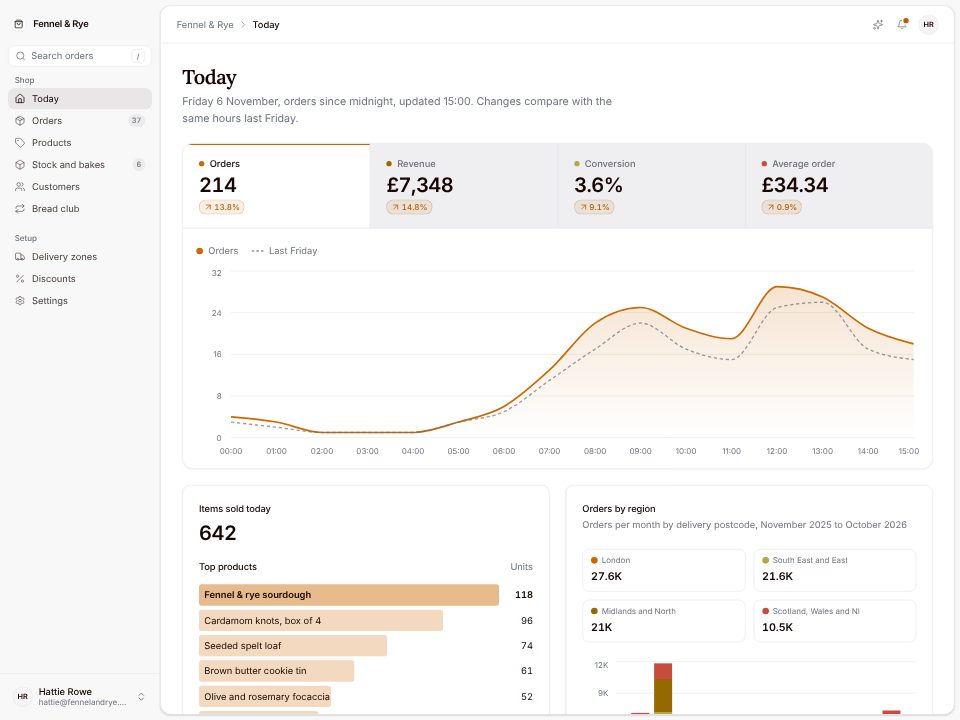
Ecommerce admin template
Fennel & Rye
A shop's day: hourly orders and revenue, where they ship, what is running low, and the order list.
Name the business and the numbers you look at every week: revenue and churn, orders and stock, deliveries and on-time rate, tickets and response times. The App Builder lays them out as a dashboard with a sidebar, KPI cards, charts and tables, built on shadcn/ui and Tremor-style blocks.
Every chart is filled with realistic sample data that fits your business, so you can judge the screens before any real numbers are involved. When the layout is right, you swap the sample data for yours.
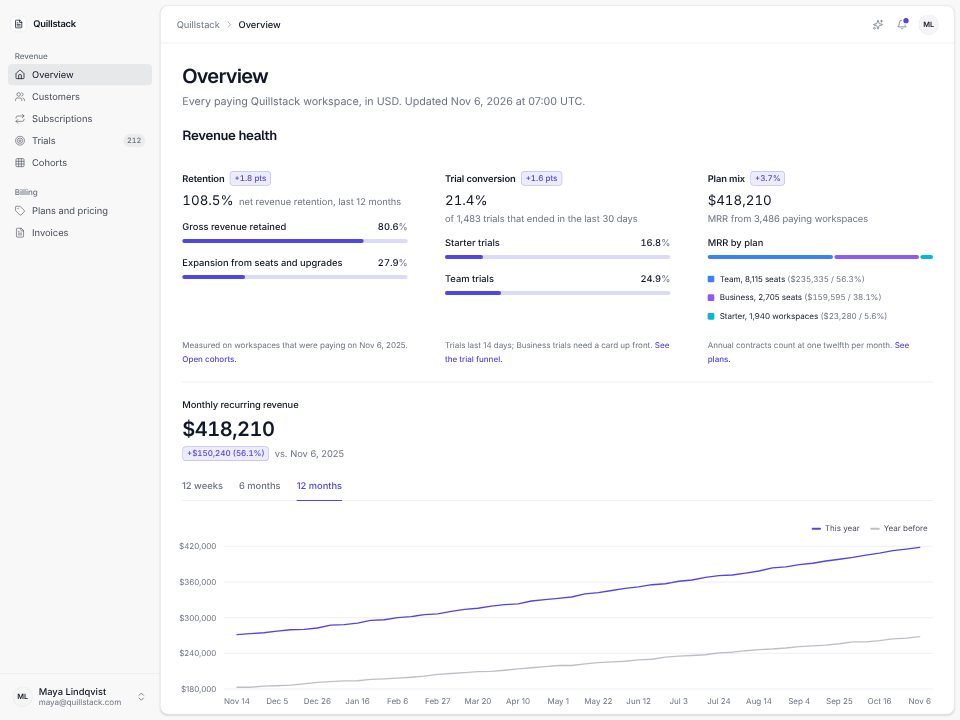
SaaS revenue
Recurring revenue for a SaaS: MRR movements over twelve months, retention, trials and plan mix.
A few sentences about the dashboard: what it's for, who reads it, and the real facts it should show.
Click any text to change it, switch the theme, or ask the chat for a new section or page.
Publish the dashboard to a live link from the builder and keep editing afterwards.
Fennel & Rye
A shop's day: hourly orders and revenue, where they ship, what is running low, and the order list.
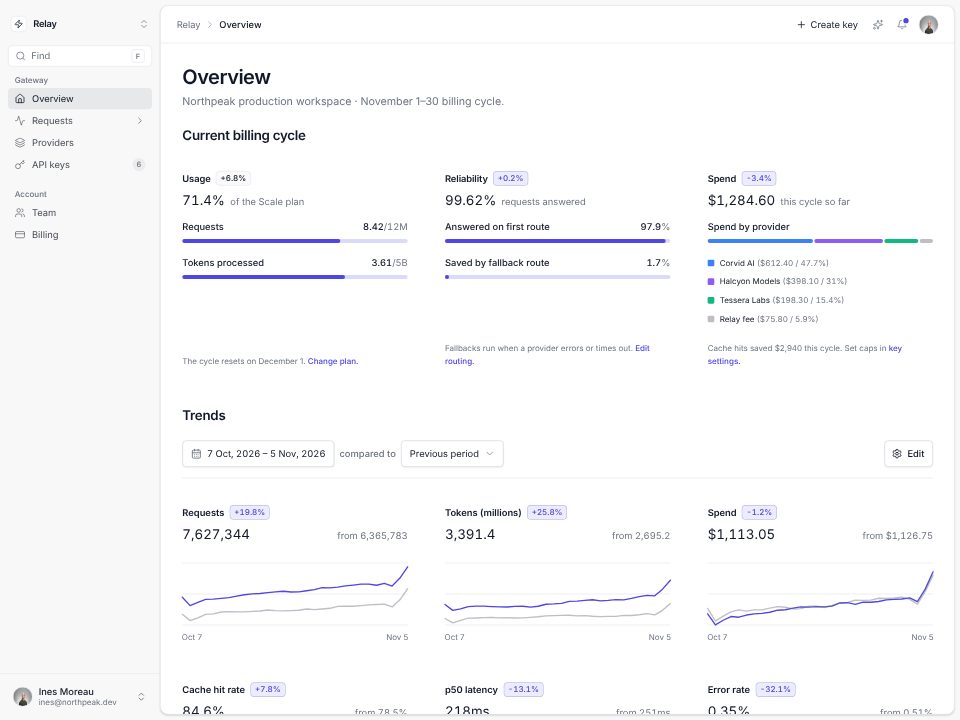
Usage and billing for an LLM gateway: the current cycle, 30-day trends, provider latency and uptime.
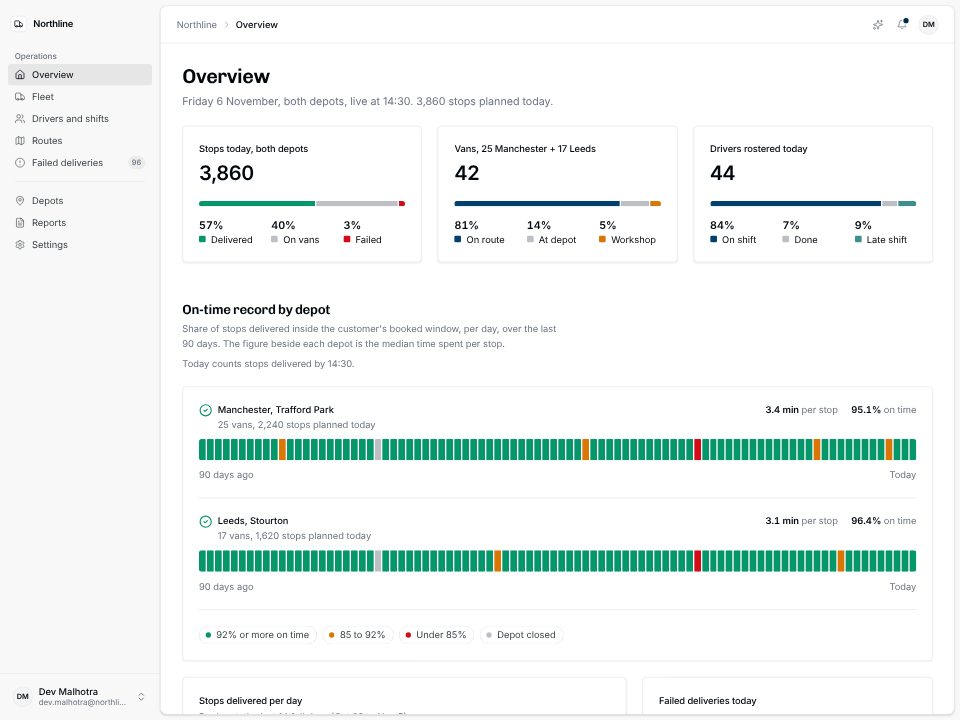
Northline Couriers
A courier's operations board: stops, vans and drivers, on-time rate per depot and failure reasons.
Parcelpoint
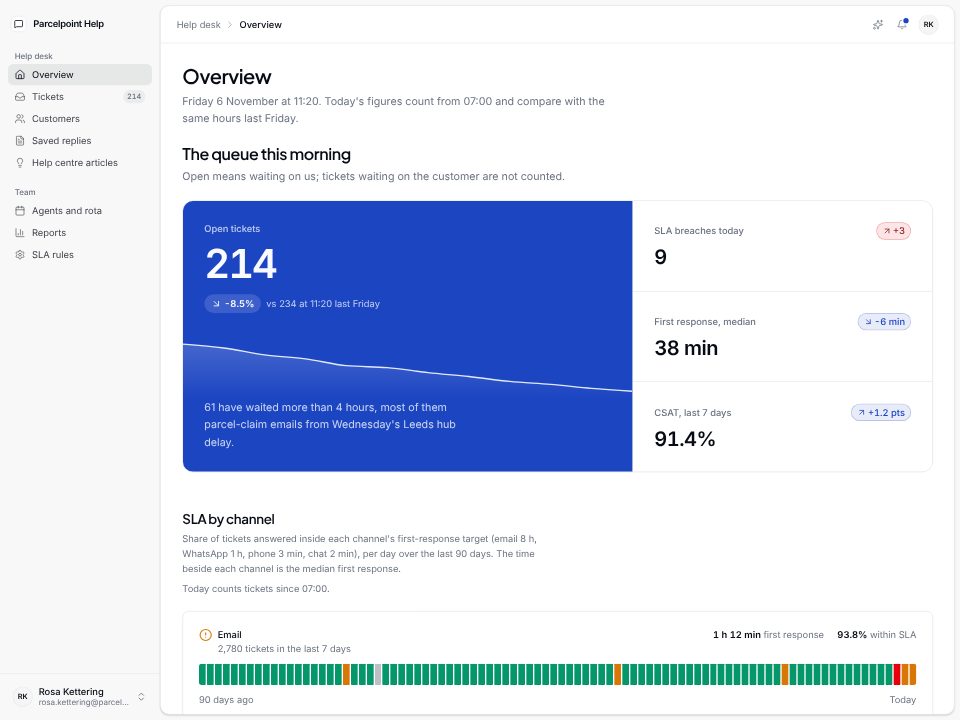
A help desk at a glance: the open queue, SLA per channel, agent workload and the ticket list.
No, not by itself. The builder makes the dashboard's screens and fills them with sample data. Showing your live numbers means connecting it to your database, API or spreadsheet, which is a separate step and needs your own access details.
The builder writes it to match your prompt: a shop gets orders and products, a courier gets vans and stops. It's made up so the screens look real, so don't use it for decisions.
React and Tailwind, with shadcn/ui components and Recharts charts in a Tremor-style layout. You can read and change every file.
Yes. Ask the chat for a new page (Customers, Orders, Fleet), a different chart type, or a metric you forgot. Content lives in small data files, so most changes are quick.
The business, who reads the dashboard and the five or six numbers they care about. Real plan names, prices and locations make the sample data far more believable.